(2) Drawing with Concepts
Definition: Creating a data visualization image manually (in a technology augmented way) by expressed theories or concepts, pure logic, descriptive observations, or normative conditions
Here, the data is abstracted inductively (there are mass observations of the world and rules are abstracted or generalized from that) or deductively (there are rules that are logically applied)... Drawing with concepts may involve "thought experiments" and imagination-based scenarios.
Another way to express a data visualization is to use a variety of drawing and diagramming methods to communicate ideas and relationships. These may be theoretical ideas. These may involve concepts. These drawings may depict models and ideas from pure logic or reasoning. (There does not necessarily have to be an empirical tie.)
Microsoft Visio 2010
MS Visio is a 2D diagramming tool that enables drawing for a variety of fields using various templates or a free-form grid. This tool has a wide range of other functionalities. Various data visualizations may be linked to spreadsheets or databases that will automatically update the data visualization.
MS Visio is a proprietary and commercial software tool.

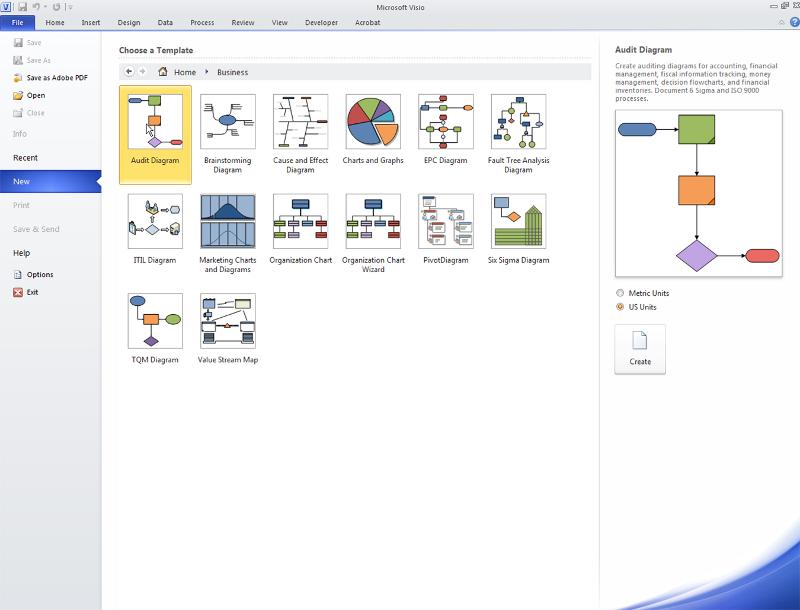
Fig. 9: A Screenshot of the "Business" Template Types in Microsoft Visio
(This is where we--as a group--will describe the process of a data crawl in NodeXL and co-draw a process in Microsoft Visio. We'll discuss some of the conventions of a 2D flowchart. The group-derived flowchart will be posted here after the conference.)
Microsoft Visio Templating from Various Professional Domains: Business, Engineering, Flowchart, General, Maps and Floor Plans, Network, Schedule, Software and Database

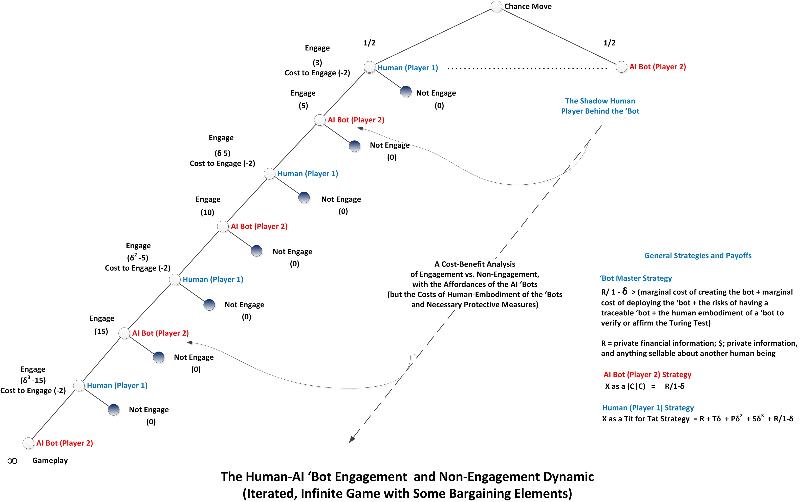
Fig. 10: An Application of a "Game Theory" Conceptualization of a Human Interaction with a Malicious Social 'Bot in an Immersive World
(The above is a sample of a "game theory" conceptualization that is essentially based on logic and concept. This diagram was created by the author and is in a copyrighted text.)
