EXAMPLE: HIGHER EDUCATION / ACADEMIA
Currently, academic publications have included social network research in a variety of domain fields:
- anthropology
- political science
- economics
- computer science
- law enforcement
- biology and other life sciences
- environmental sciences
- public administration
- public health
- human medicine
- veterinary medicine
- marketing (such as social mapping, opinion leader identification in word-of-mouth marketing, and cool-hunting)
- online learning
- business administration, and others
Starting Simply... :)
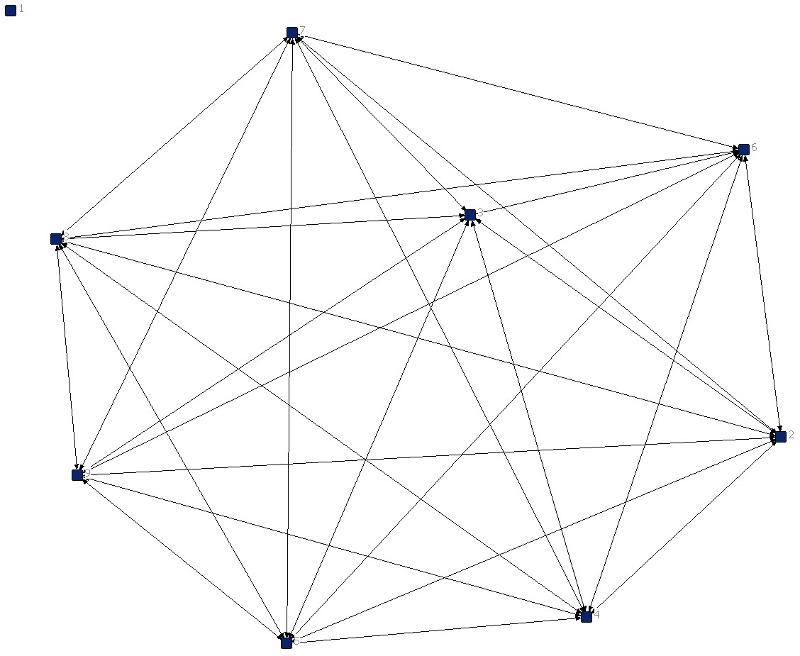
The Secret Life of a Work Group in iTAC (at K-State)
(Note: The "isolate" node at the top left is actually an artifact of my Excel file. The members of the group run from Nodes 2 - 9. This shows that the members of the team are highly interconnected with each other. There's a lot of communication going on. This is my first node-link diagram using UCINET.
Earlier, I've drawn others manually with Microsoft Visio. That would be known as the hypothesis-driven approach to thinking and research, beginning with an educated idea. Using a data visualization tool like UCINET, though, enables much more data-driven analysis--letting the information depict the social network and relationships. This latter approach begins in a somewhat unstructured way, which enables the software to examine the coded data and find out what relationships exist within that data set.
This particular workplace network looks fairly resilient. It is not very hierarchical. It looks like communications and resources move fairly evenly throughout the team. There are no obvious "fat nodes" because of the even distribution. There is no clear way to exploit the relationships here because of the resilience and lack of non-transitive triads.)
Online Learning
In online learning, the social networks have focused on how to promote community building in an online classroom for more communications. Co-authorship networks have been explored to understand whether small-world networks exist in various research fields (they do). There are explorations of the (Paul) Erdõs number to see how closely a researcher in a domain may relate to a particular prolific researcher.
What are some other potentials? What research would enhance awareness and decision-making in higher education? ("Neural network" depictions are node-link diagrams as well, with complex decision junctures modeled as complex sequences of yes / no decisions. Such networks are complex types of "decision trees," in one conceptualization.)
|
Let's Talk!
- 1. ENHANCING HIGHER EDUCATION: How may educators use social network software tools to enhance the art of higher education? Where can we create value-added information and visualizations?
- 2. THE C2C SOCIAL NETWORK: If Colleague 2 Colleague (C2C) were to be analyzed as a social network using UCINET, who would be the "fat nodes"? In terms of network centrality, who would the fulcrums be for this social organization? Why? What would be the "in's" to be a "fat node"? What sorts of information and resources move through C2C? How would you go about validating / invalidating your model? How would you gather sound information? Further, how would you improve this organization to enhance the sharing of expertise and experience? resources? social connections? How would you help shorten the paths to various goals-- organizationally (the entire network), at the subnetwork level (sub-groups or cliques), and individually (the ego / node level)? How would you increase the organization's resilience (structural cohesion)?
- 3. SELECTING A UNIQUE NODE to PARTNER ON PROJECTS: In selecting a co-author for an academic publication, what sorts of social network connectivity would you look for and why? How closely would you want them connected to your own social networks? What criteria would you use for your selection?
- 4. AN ACADEMIC CONTENT ANALYSIS: In terms of your own academic provenance, who would your main influences be in terms of thinkers, theories, and practices? Why? What would that content network look like? (Or if you are not in academia, approach this as a professional question.) (Note: It looks like one has to use a software like NVivo to capture and code the contents for the analysis. (Its Ncapture feature enables the capture of data from some websites using two different browsers.) NVivo has its own way to depict visualizations of data. Or the data set may be moved from NVivo to a diagramming / data analysis / data visualization tool like UCINET. Or if possible, one can manually code into UCINET's spreadsheet table.)
|
toc | return to top | previous page | next page
