Other (More Complex) Data Visualizations
Global Demographic Trends
Gapminder
Dr. Hans Rosling
"No More Boring Data" (TED, 2007)
http://www.youtube.com/watch?v=hVimVzgtD6w
"New Insights on Poverty" (TED, 2007)
http://www.ted.com/talks/hans_rosling_reveals_new_insights_on_poverty.html
"Let my Dataset Change your Mindset" (TED, 2009)
http://www.ted.com/talks/hans_rosling_at_state.html
"Hans Rosling: Asia's rise—how and when" (TED, 2009)
http://www.ted.com/talks/hans_rosling_asia_s_rise_how_and_when.html
"Hans Rosling on Global Population Growth" (TED, 2010)
http://www.ted.com/talks/hans_rosling_on_global_population_growth.html
"Hans Rosling: The good news of the decade?" (TED, 2010)
http://www.ted.com/talks/hans_rosling_the_good_news_of_the_decade.html
"Hans Rosling and the magic washing machine" (TED, 2011)
http://www.ted.com/talks/hans_rosling_and_the_magic_washing_machine.html
Geological Visualizations
US Geological Survey (USGS)
http://glovis.usgs.gov/ (Global Visualization)
USGS Seamless Data Warehouse
USGS EarthExplorer
http://earthexplorer.usgs.gov/
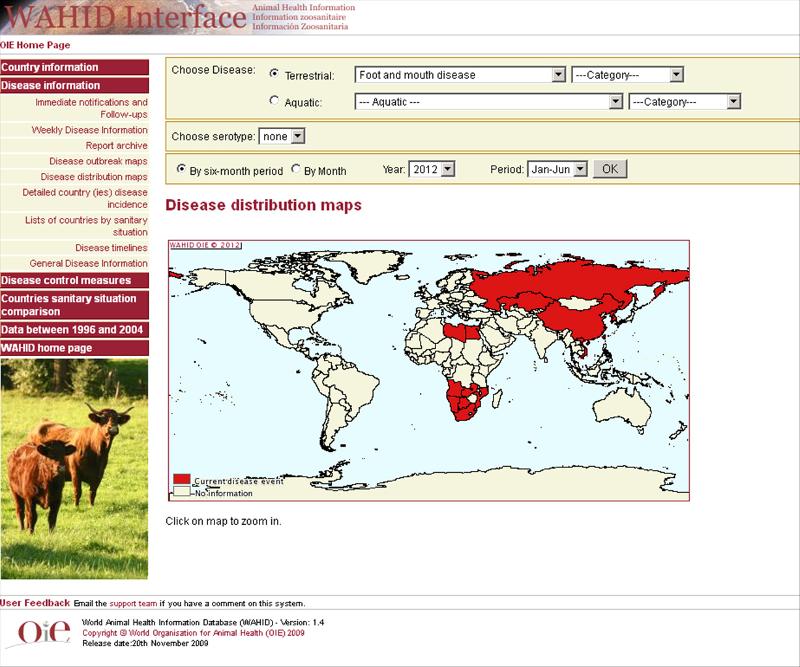
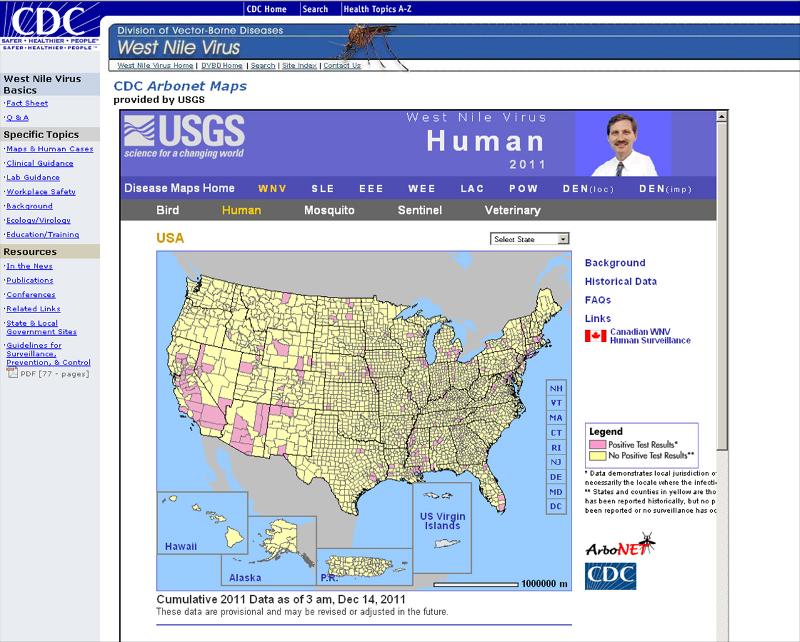
Disease Distribution and Spatiality
![]()
OIE: World Organization for Animal Health / Interactive Disease Distribution Maps
(World Animal Health Information Database / WAHID Interface)
![]()
CDC Arbonet Maps
http://www.cdc.gov/ncidod/dvbid/westnile/USGS_frame.html
Educational Knowledge Tracking
Khan Academy
http://www.khanacademy.org/exercisedashboard
http://www.khanacademy.org/login?continue=http%3A//www.khanacademy.org/profile
The Analysis of Large Data Sets (Terabytes of Data, Billions of Records)
Google BigQuery (2010)
https://developers.google.com/bigquery/
Google Research Blog
http://googleresearch.blogspot.com/
Using Excel for Web Visualizations
Data Wiz Blog
|
Dr. Shalin Hai-Jew Instructional Designer Kansas State University 785-532-5262 shalin@k-state.edu
|
Note: This presentation was built using SoftChalk 7. The Flash animation was built with Adobe AfterEffects. Microsoft Visio was used for the annotated screenshots with the pull-outs of information. Adobe Photoshop was used for minor photo editing. A Web-based ASCII-art generator was used to create the ASCII-text art.
This was updated in May 2012.
